Using the debugger
Using the Eclipse debugger is easy and can save you a lot of time once you know how to use it. To use it, you must first launch your app in the debugger. To do this, simply right-click the project in the WOExplorer and select "Debug as > WOApplication" to start your app. Optionally, you can select the app and click the debug icon on the tool bar.

Once you've launched the app into the debugger one time, you can simply select the app name from the debug toolbar icon's pulldown menu in the future.

Now that your application is running in debug mode, you can set breakpoints to stop execution anywhere in your code. If you are throwing an error, then you may want to set a break point on the line that throws the error. To set a breakpoint, you can either double click beside the line you are interested in, or you can right click and choose "Toggle Breakpoint" instead.

Once you have a breakpoint set, the application will halt execution any time it reaches the line containing the breakpoint. This will take you into the debug perspective of Eclipse.
Starting at the top right, you see a view with Variables and Breakpoints. The Breakpoints tab is a simple list of all your breakpoints in one place. You can enable and disable them by checking/unchecking them. Double clicking them will take you to the breakpoint in your source code.

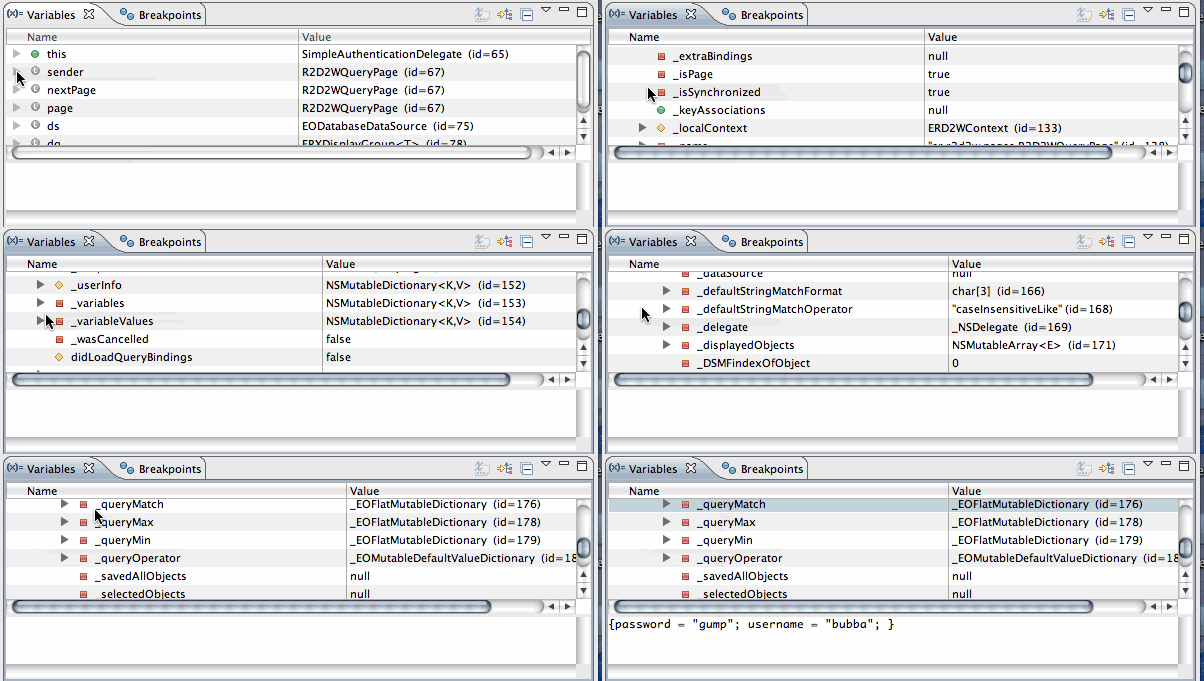
The Variables tab is much more interesting. It shows all the variables available in your current frame of reference. When you first drop into the debugger, this will be the method where the breakpoint is set. The variables tab allows you to inspect all the variables of your application, live, as the app is executing. This allows you to inspect all your objects rather deeply. For instance, you can inspect a page, the display group in the page, as well as the values in the display group's queryMatch dictionary as they were the moment the debugger paused execution of the code.

Next to the Variables and Breakpoints tabs, you will see the debug view in the top left. In this view, you'll automatically be taken to the thread you are executing and get what is essentially a live stack trace of your application. Initially, you will be in the method where you set the breakpoint, but you can select any method in your stack to see the state of the variables in the calling methods as well.
Above this, you'll see a toolbar. The resume button lets you break out of debugging and resume the normal flow of the application. The terminate button works exactly like it does in the run perspective. Beside the resume and terminate buttons, you'll see "Step into", "Step Over", "Step Return", and "Drop to Frame".

The "Step into" button allows you to step into a method in your code. For instance, if you were to call WORequest r = context().request(); this would first drop you into the context() method. If you have source code available for the method you step into, the debugger will automatically open it for you so you can follow it with the code execution. If not, you can still debug, but you'll do so blindly. You only get to see what's happening in the method by watching what comes up in the variables tab and the debug view.
The "Step over" button allows you to follow the code without actually dropping into the methods being called. In the example above, stepping over would simply skip to the next line and add the returned value of 'r' to your variables tab. The "Step into" button acts just like "step over" when the line of code has no method call. For example, if you were to press "Step into" on a line like int i = j++; the result would be the same as pressing "Step over".
The "Step return" button is essentially the same as pressing the "Step over" button as many times as necessary to finish the current method. This will return you to the method that called the method in your current frame.
Finally, the "Drop to frame" button allows you to restart a method, and return the the very beginning of it. It's like a rewind button. If you select a method in your debug view and then press "Drop to frame" all the methods in the stack above it will disappear and you can follow execution all the way back up to the point of your breakpoint and beyond if you like.
One last thing worth mentioning is that you can also view the value of a variable in your source by simply hovering the mouse cursor over the variable in the source code.
